5Every day, 9 people in America die in traffic crashes caused by distracted drivers. This serious issue affects road safety nationwide. In 2022, there were 42,514 motor vehicle crash deaths in the USA, with 3,308 (7.78%) caused by distracted driving.
Our study examines distracted driving in America for 2025. Using the latest data from the National Highway Traffic Safety Administration (NHTSA), we analyzed fatalities and the involvement of distracted drivers. We also looked at age, gender, and timing related to these incidents.
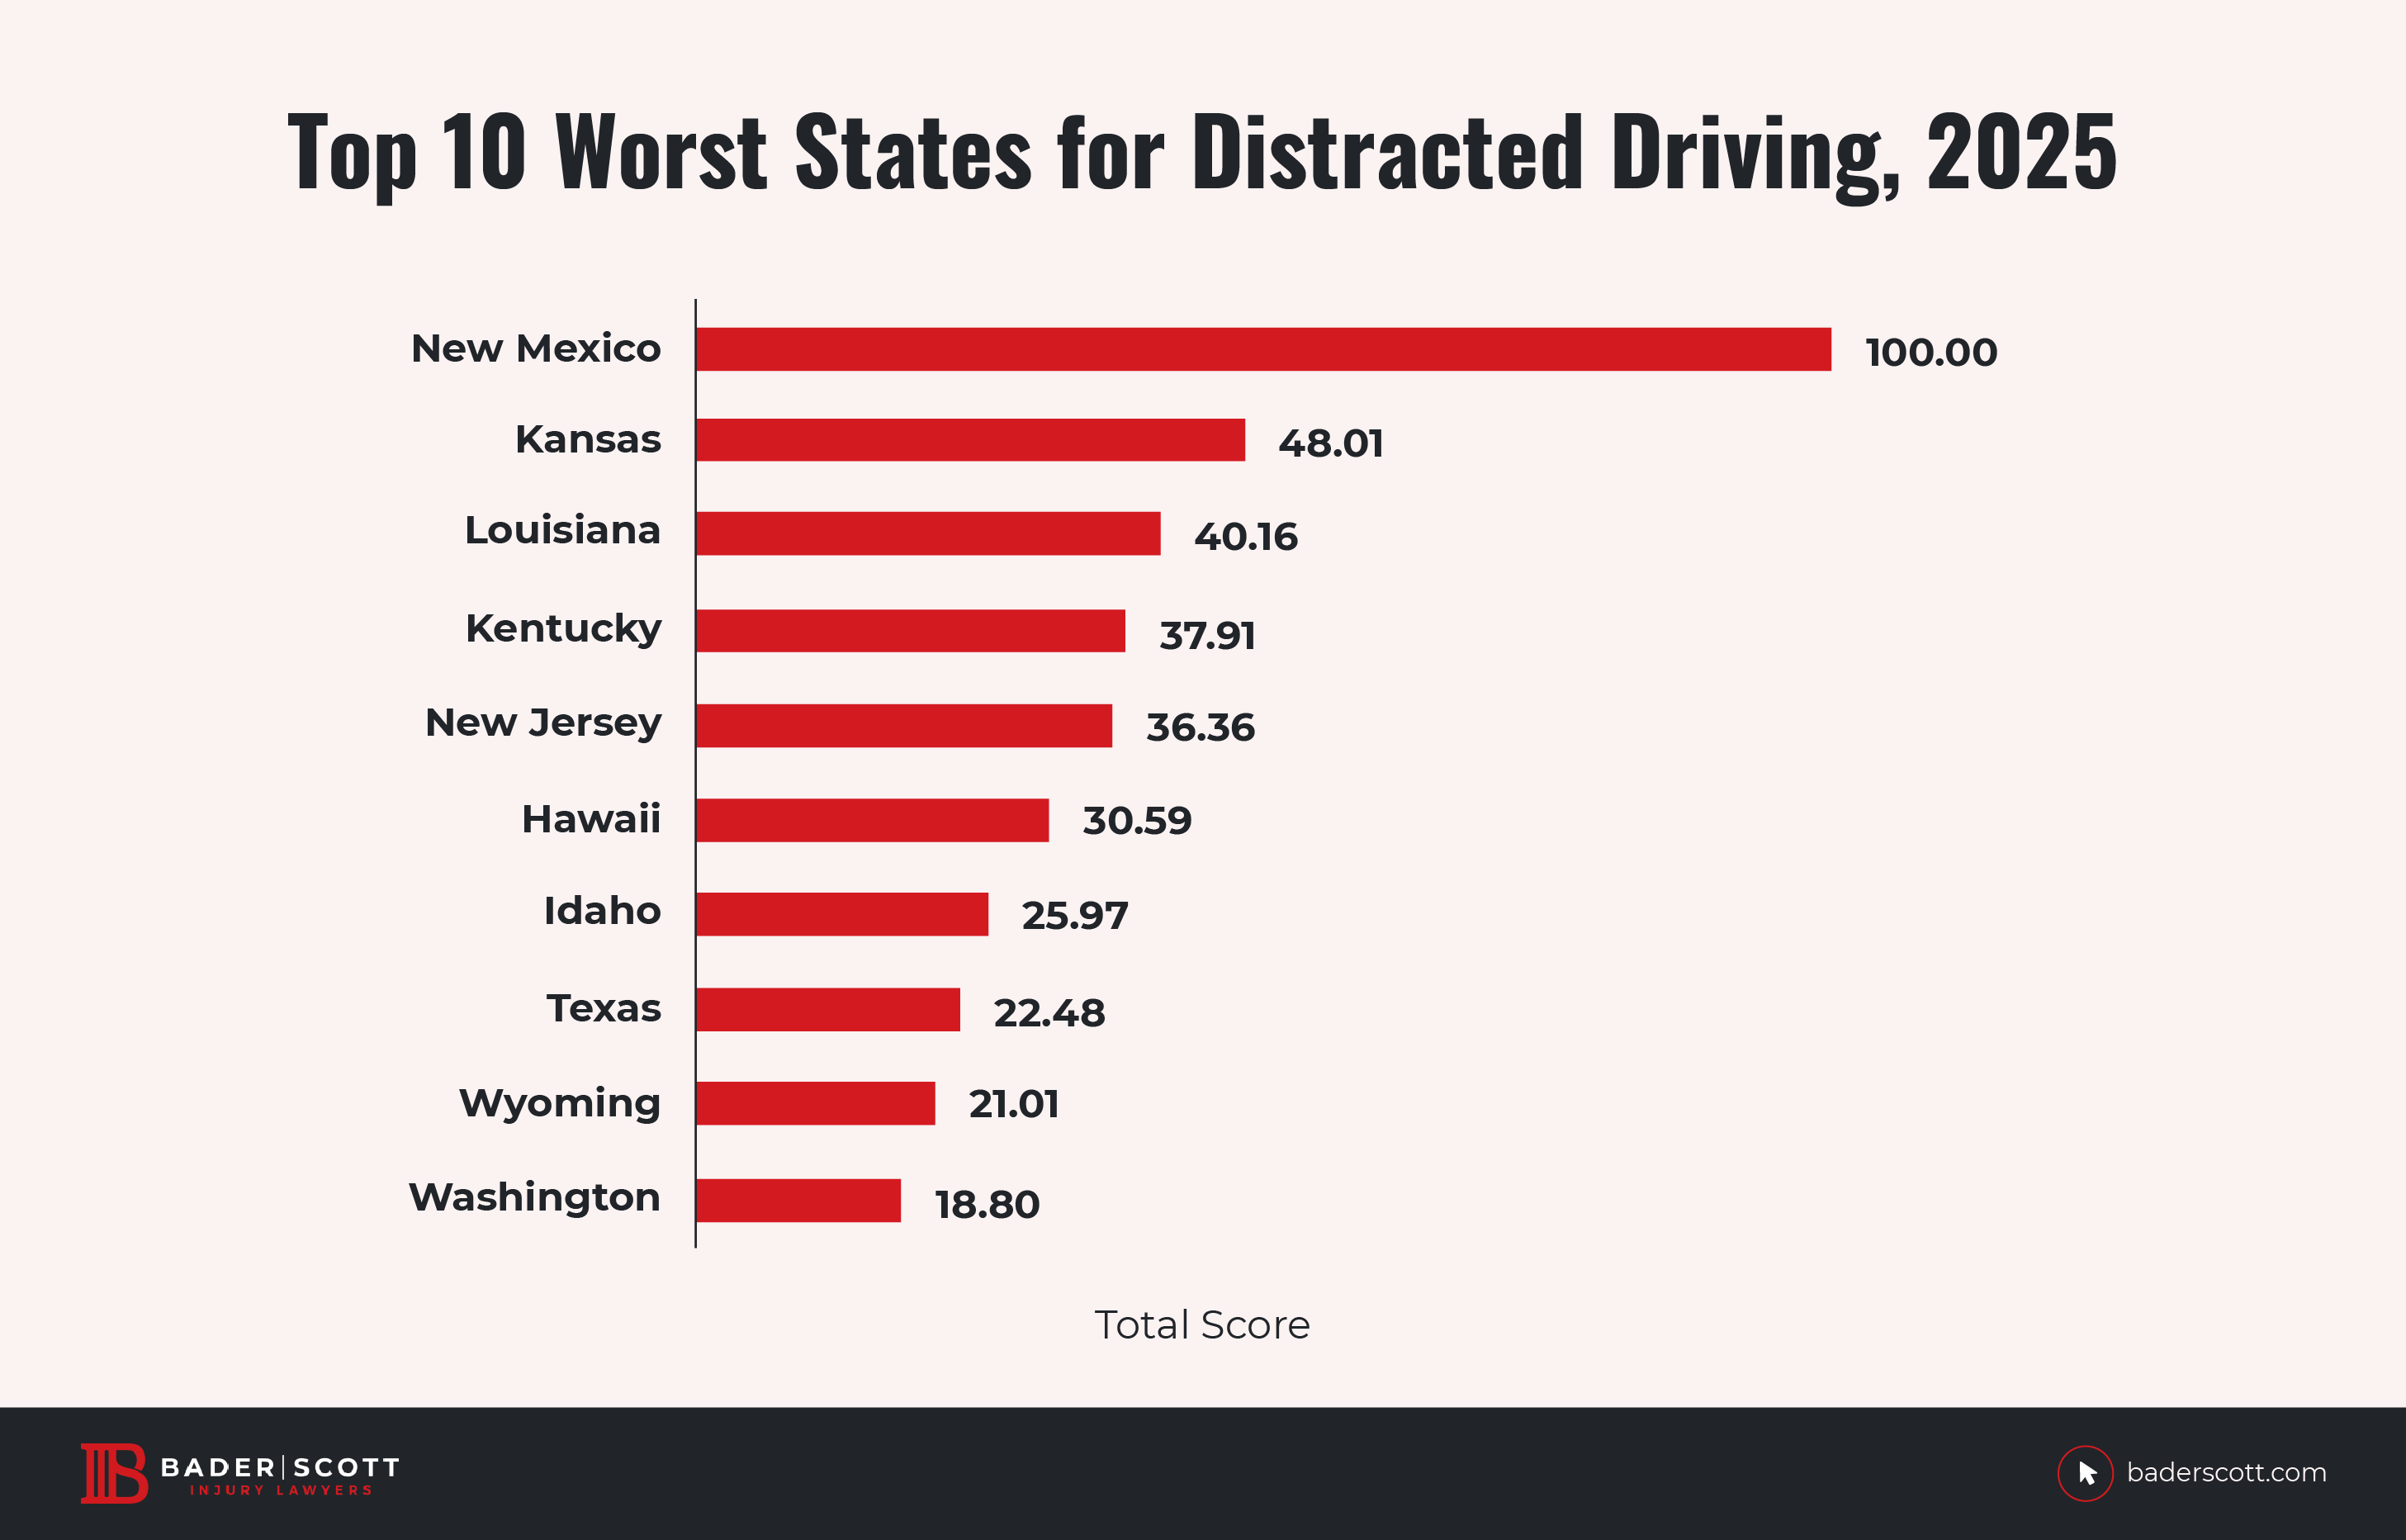
From this data, we identified key findings and ranked the states based on their distracted driving statistics. For instance, New Mexico has the highest percentage of traffic crash deaths caused by distracted drivers at 40%. Our goal is to highlight the worst states for distracted driving and raise awareness about this growing problem.
Key Findings
Annual Fatalities:
3,308 American lives were lost due to distracted driving out of a total of 42,514 crash deaths in 2022.
Top 3 Worst States:
New Mexico, Kansas, and Louisiana are the top 3 worst states for distracted driving, with New Mexico having the highest percentage of traffic crash deaths caused by distracted drivers at 40%.
Yearly Average:
On average, 3,132 people die in fatal crashes involving distracted drivers each year.
Age Group Impact:
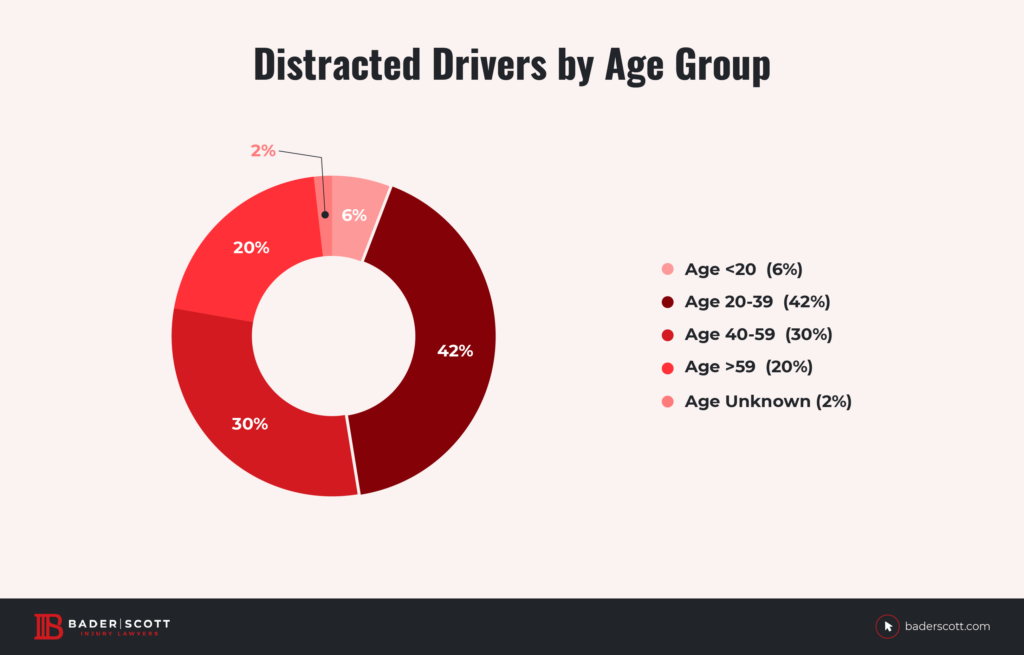
Nearly 6% of distracted drivers involved in fatal crashes are teenagers. However, a significant 42% of distracted drivers are between the ages of 20 and 39.
Trend Analysis:
Distracted driving fatalities increased by 14% from 2018 to 2022, but decreased by 6.44% from 2021 to 2022.
Types of Distracted Driving
Distracted driving is a major issue, but many people don’t realize how many different forms it can take. It’s not just about texting or talking on the phone; there are other distractions that can be just as dangerous.
The Centers for Disease Control and Prevention (CDC) breaks down distracted driving into three main types:
Visual distractions:
These occur when you take your eyes off the road. This could be using a GPS, looking at billboards, checking out an accident, or even admiring the scenery.
Manual distractions:
These happen when you take your hands off the wheel. Eating, using your phone, adjusting the radio, or reaching for something in the car all fall into this category.
Cognitive distractions:
These occur when your mind isn’t focused on driving. This could be daydreaming, talking, worrying, or even singing along to your favorite song.
Understanding these types of distractions can help us all be more aware and safer on the road.
_________________________________________________________________________________________________
Key Distracted Driving Statistics, 2025
These statistics shed light on the severe impact of distracted driving on road safety.

Around 3,132 People Die Annually Due to Distracted Driving
Each year, approximately 3,132 people lose their lives in car accidents caused by distracted drivers. This accounts for about 7.78% of all fatal motor vehicle collisions in the United States.
9 Americans Die Every Day on Average Due to Distracted Driving
Distracted driving takes a daily toll, with 9 people dying each day due to these preventable accidents. This alarming rate emphasizes the need for heightened awareness and stricter regulations.
Total Fatal Accidents Involving Distracted Drivers
In the past five years, from 2018 to 2022, there were 15,960 total fatalities involving distracted drivers. This high number demonstrates the significant impact of distracted driving on road safety.
14% Increase in Distracted Driving Fatalities (2018-2022)
Distracted driving fatalities increased by almost 14% from 2018 to 2022. This rising trend highlights the growing concern over distracted driving behaviors.
8.75% of Drivers Involved in Fatal Crashes Were Distracted
Out of 60,048 drivers involved in fatal crashes in 2022, 8.75% were distracted. This statistic underscores the prevalence of distracted driving among those responsible for fatal accidents.

6% of Distracted Drivers Were Teenagers
Nearly 6% of distracted drivers involved in fatal crashes were teenagers under 20 years old.
42% of Distracted Drivers Were Young Adults
A significant 42% of distracted drivers were aged between 20 and 39 years, highlighting this age group as the most prevalent among distracted drivers.
30% of Distracted Drivers Were Middle-Aged
30% of distracted drivers were between the ages of 40 and 59, making this another significant age group involved in fatal crashes.
Worst States for Distracted Driving, 2025 (Map)
Ranking the Worst States for Distracted Driving(Table)
Top 10 Worst States for Distracted Driving, 2025

1. New Mexico
New Mexico ranks as the worst state for distracted driving in 2025, with a final score of 100. In 2022, the state saw a total of 185 fatalities caused by distracted drivers, which is alarmingly high. This means that 40% of all fatal accidents in New Mexico were due to distracted driving, significantly higher than the national average of 7.78%.
At least 18.83 out of every 100,000 licensed drivers in New Mexico were involved in fatal crashes due to distracted driving. This rate is notably higher than the national average. Furthermore, 8.75 people per 100,000 residents were killed by distracted drivers, emphasizing the severity of the problem in New Mexico.
Compared to the national data, New Mexico's statistics are stark. Nationally, distracted driving accounts for approximately 7.78% of all fatalities, but in New Mexico, it accounts for nearly 40% of fatal crashes. This highlights the critical need for more stringent distracted driving laws and enforcement in the state to address this severe issue.
2. Kansas
Kansas ranks as the second worst state for distracted driving in 2025, with a final score of 48.01. In 2022, the state reported 110 fatalities caused by distracted drivers. This means that 26.83% of all fatal accidents in Kansas were due to distracted driving, which is significantly higher than the national average of 7.78%.
At least 6.87 out of every 100,000 licensed drivers in Kansas were involved in fatal crashes due to distracted driving. Additionally, 3.74 people per 100,000 residents were killed by distracted drivers, emphasizing the state's severe issue with distracted driving.
Compared to national data, Kansas's statistics are concerning. The high percentage of fatalities and driver involvement in fatal crashes due to distracted driving highlights the urgent need for targeted interventions and stricter enforcement of distracted driving laws in the state.
3. Louisiana
Louisiana takes the third spot on our list of the worst states for distracted driving in 2025, with a final score of 40.16. The state experienced 157 fatalities due to distracted drivers in 2022. This represents 17.33% of all fatal accidents in Louisiana, which is more than double the national average of 7.78%.
In terms of driver involvement, 7.17 out of every 100,000 licensed drivers in Louisiana were involved in fatal crashes caused by distracted driving. Additionally, 3.43 people per 100,000 residents lost their lives due to distracted drivers.
Louisiana's figures highlight a critical issue with distracted driving that surpasses national statistics. The significant percentage of fatalities and high involvement rates underscore the need for enhanced measures and awareness campaigns to address distracted driving in the state.
4. Kentucky
Kentucky ranks fourth on our list with a final score of 37.91. In 2022, the state reported 128 fatalities due to distracted driving. This accounts for 17.20% of all fatal accidents in Kentucky, which is more than twice the national average of 7.78%.
When looking at driver involvement, 7.32 out of every 100,000 licensed drivers in Kentucky were involved in fatal crashes caused by distracted driving. Additionally, 2.83 people per 100,000 residents were killed by distracted drivers, highlighting the significant impact of this issue within the state.
Kentucky's data reveals a troubling trend in distracted driving incidents, with higher-than-average fatalities and driver involvement rates. This points to the necessity for stronger laws and greater public awareness efforts to combat distracted driving in Kentucky.
5. New Jersey
New Jersey is ranked fifth in our analysis, with a final score of 36.36. In 2022, the state saw 183 fatalities attributed to distracted driving, representing 26.72% of all fatal accidents in the state. This is significantly higher than the national average of 7.78%.
Regarding driver involvement, 4.46 out of every 100,000 licensed drivers in New Jersey were involved in fatal crashes due to distracted driving. Moreover, 1.97 people per 100,000 residents were killed by distracted drivers.
New Jersey's high percentage of fatalities and driver involvement rates indicate a serious distracted driving problem. These statistics emphasize the urgent need for enhanced distracted driving prevention measures and stricter enforcement of existing laws to improve road safety in the state.
6. Hawaii
Hawaii ranks sixth on our list with a final score of 30.59. In 2022, the state recorded 25 fatalities due to distracted drivers, accounting for 21.55% of all fatal accidents in Hawaii. This percentage is significantly higher than the national average of 7.78%.
Regarding driver involvement, 3.95 out of every 100,000 licensed drivers in Hawaii were involved in fatal crashes caused by distracted driving. Additionally, 1.74 people per 100,000 residents were killed by distracted drivers, highlighting the severity of this issue in the state.
7. Idaho
Idaho takes the seventh spot in our ranking with a final score of 25.97. In 2022, the state reported 35 fatalities due to distracted drivers, which accounts for 16.28% of all fatal accidents in Idaho. This is more than twice the national average of 7.78%.
In terms of driver involvement, 3.52 out of every 100,000 licensed drivers in Idaho were involved in fatal crashes caused by distracted driving. Additionally, 1.78 people per 100,000 residents were killed by distracted drivers.
8. Texas
Texas ranks eighth on our list with a final score of 22.48. In 2022, the state experienced 495 fatalities due to distracted driving, which constitutes 11.23% of all fatal accidents in Texas, above the national average of 7.78%.
When looking at driver involvement, 4.03 out of every 100,000 licensed drivers in Texas were involved in fatal crashes due to distracted driving. Additionally, 1.62 people per 100,000 residents were killed by distracted drivers.
9. Wyoming
Wyoming ranks ninth in our analysis with a final score of 21.01. In 2022, the state recorded 12 fatalities due to distracted drivers, accounting for 8.96% of all fatal accidents in Wyoming. This percentage is higher than the national average of 7.78%.
When considering driver involvement, 3.24 out of every 100,000 licensed drivers in Wyoming were involved in fatal crashes due to distracted driving. Additionally, 2.05 people per 100,000 residents were killed by distracted drivers.
10. Washington
Washington rounds out our list, ranking tenth with a final score of 18.80. In 2022, the state saw 97 fatalities due to distracted drivers, which accounted for 13.23% of all fatal accidents in Washington, considerably above the national average of 7.78%.
In terms of driver involvement, 2.07 out of every 100,000 licensed drivers in Washington were involved in fatal crashes caused by distracted driving. Additionally, 1.24 people per 100,000 residents were killed by distracted drivers.
_______________________________________________________________________________________________
Methodology
Based on the National Highway Traffic Safety Administration (NHTSA) latest data (2022), we conducted a thorough study to determine key numbers for distracted driving in America in 2025. Our analysis covered various aspects, including total fatalities in motor vehicle crashes by state, the number of distracted drivers involved in fatal crashes by state, and data related to gender, age, and time of incidents.
Data Sources and Collection:
- NHTSA Data (2022):
We used the most recent data available from the National Highway Traffic Safety Administration to analyze distracted driving fatalities and related statistics.
- Federal Highway Administration (FHWA) Data (2022):
Data on licensed drivers by state was obtained from the FHWA.
- Census Bureau Population Data:
We used the latest population counts from the Census Bureau for accurate per capita calculations.
Key Indicators:
To rank the states, we identified three key indicators:
- Distracted Driving Fatality Percentage (30% weight):
The percentage of all fatalities in motor vehicle crashes that were caused by distracted driving.
- Number of People Killed per 100,000 Residents by Distracted Drivers (35% weight):
This measures the rate of fatalities per capita due to distracted driving.
- Number of Distracted Drivers Involved per 100,000 Licensed Drivers in Fatal Crashes (35% weight):
This indicator measures the rate of distracted drivers involved in fatal crashes per capita.
Ranking Process:
- Scoring:
Each state was scored based on the three key indicators. The scores were weighted according to the specified percentages.
- Weighted Score Calculation:
The weighted scores were calculated to derive a final score out of 100 for each state.
- State Ranking:
States were ranked from worst to best based on their final scores, with the highest score indicating the worst states for distracted driving.
Analysis and Comparisons:
- Trend Analysis:
We analyzed the trend in distracted driving fatalities over the past five years (2018-2022) to understand growth and changes.
- Comparative Analysis:
We compared state-specific data with national averages to highlight significant deviations and concerns.
- Key Findings:
Our analysis produced key findings, which include the daily impact of distracted driving, the overall growth in fatalities, and detailed statistics on driver involvement by age group.
Objective:
The primary objective of this study was to highlight the worst states for distracted driving in 2025, raise awareness about the severity of the issue, and provide insights into the need for stricter regulations and public awareness campaigns to improve road safety.
________________________________________________________________________________________________
