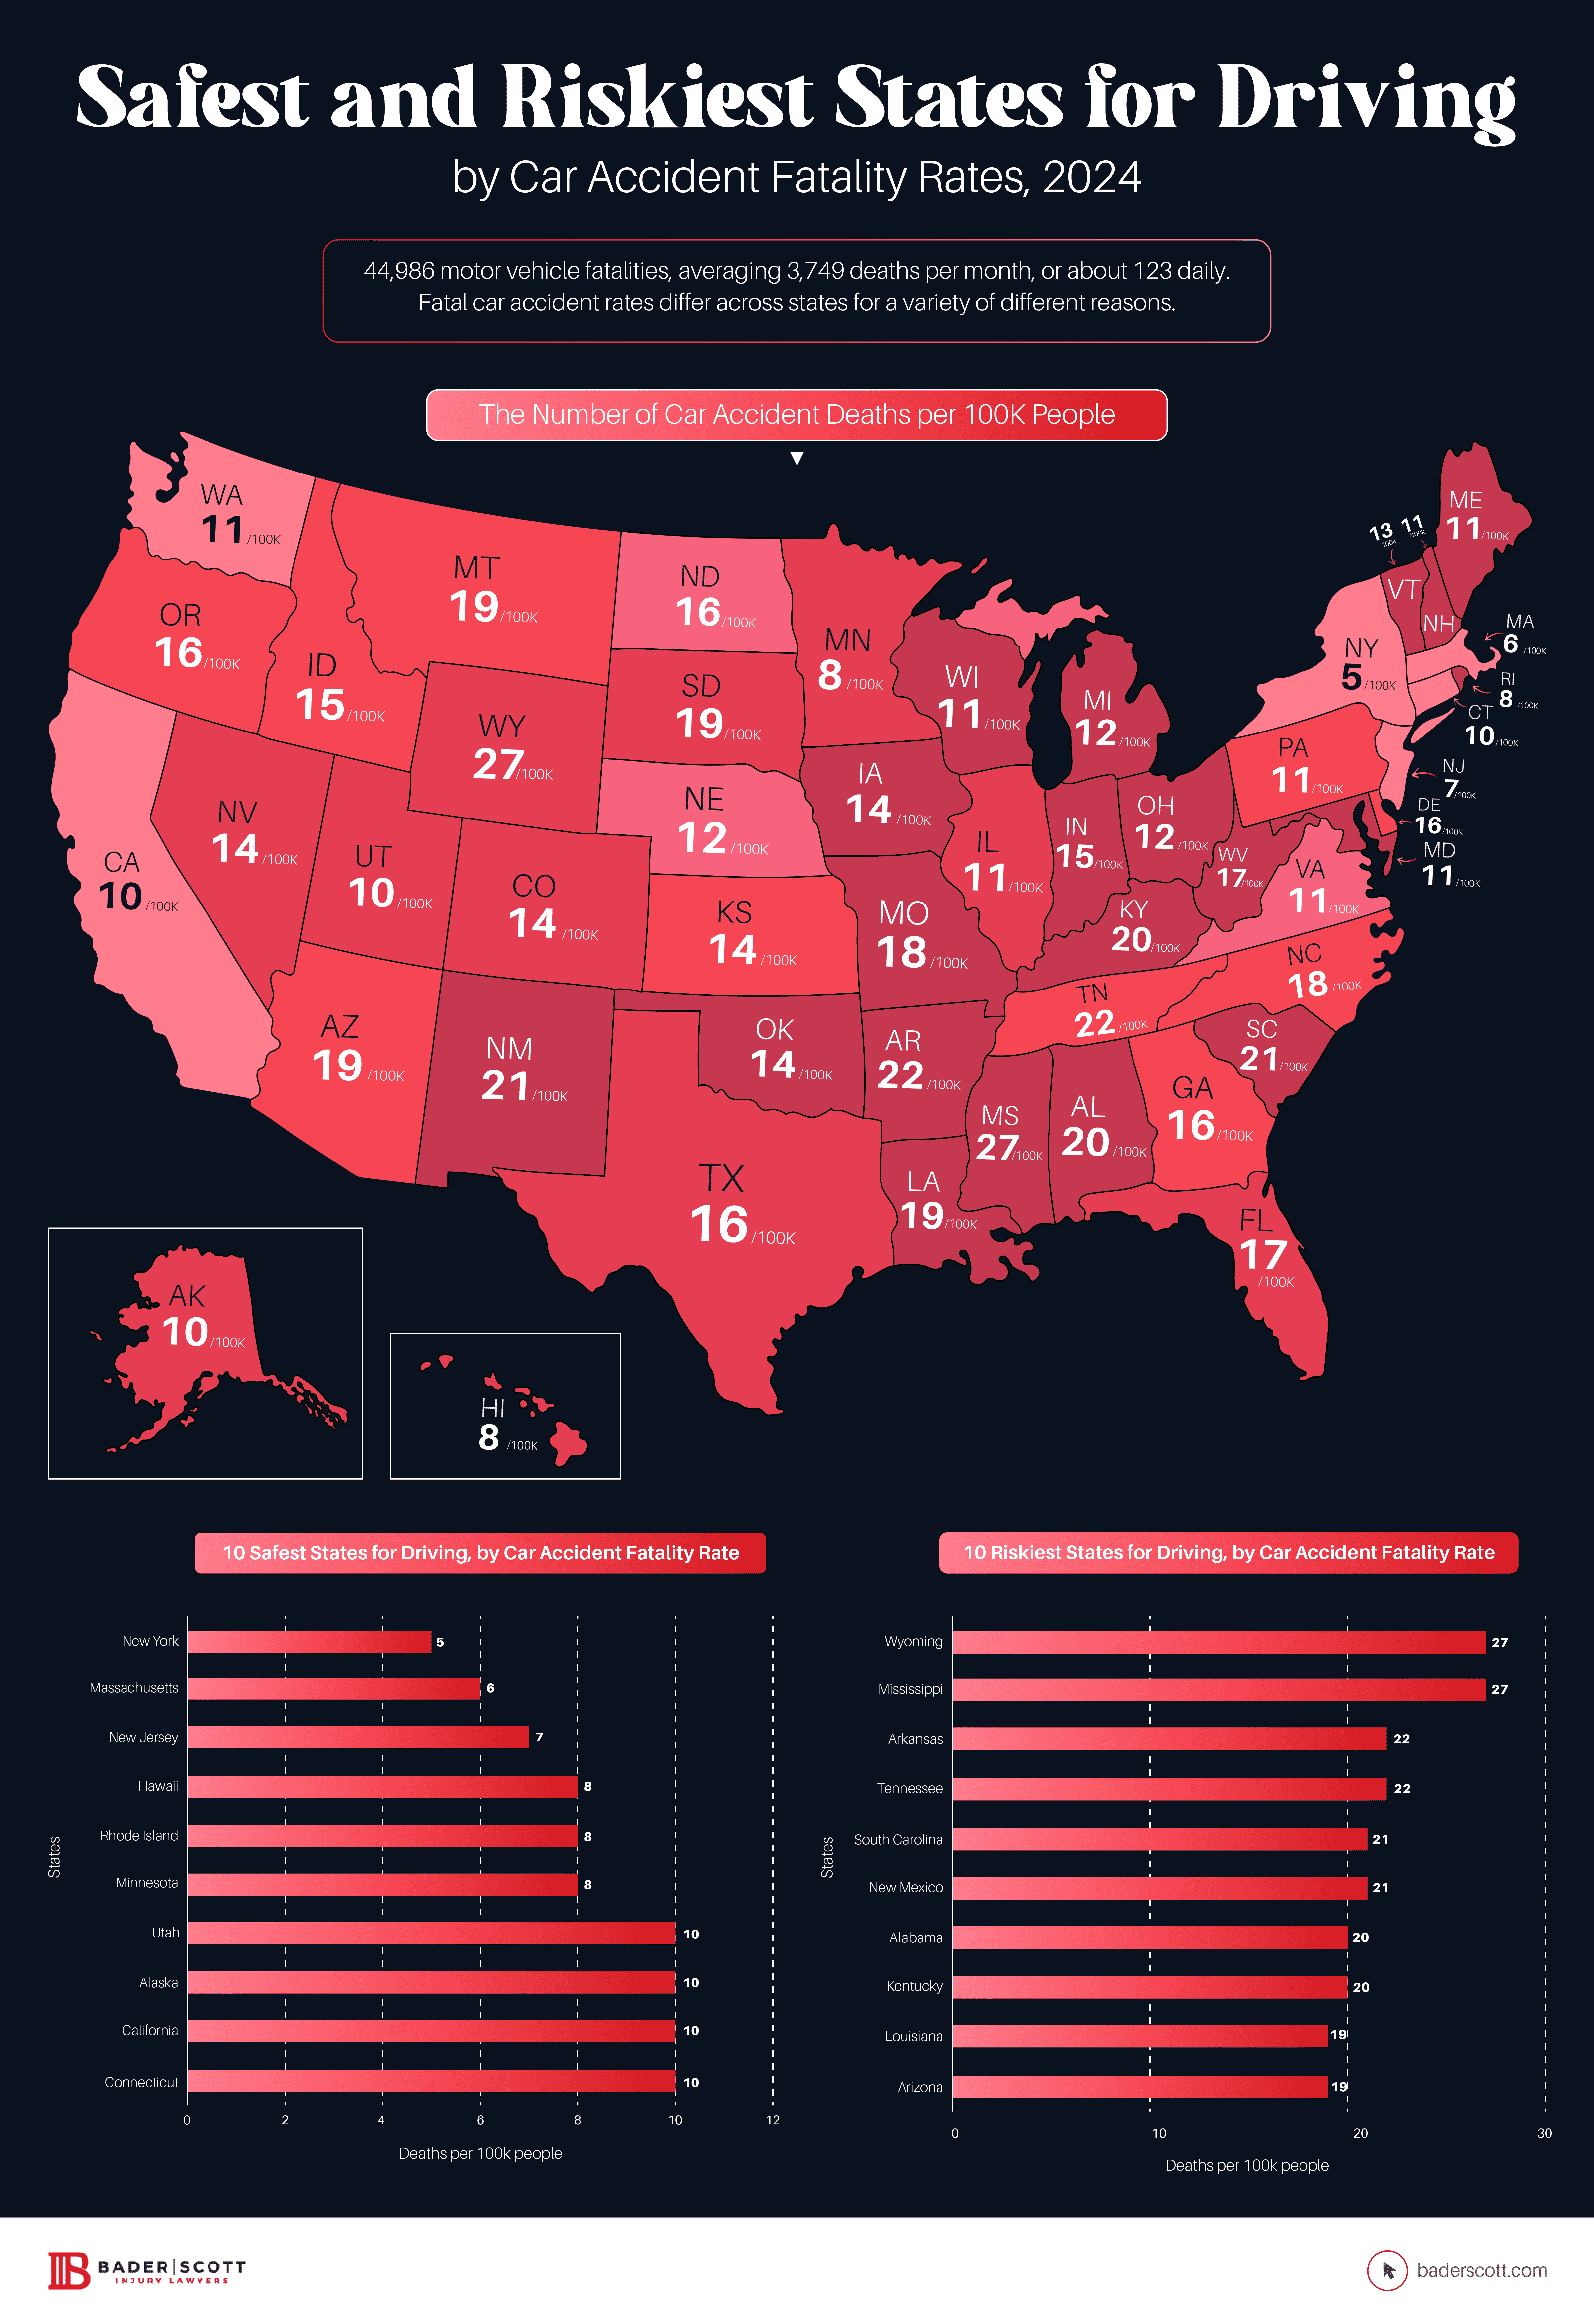
In 2023, the United States faced a significant challenge in road safety, with the National Safety Council reporting 44,986 motor vehicle fatalities, averaging 3,749 deaths per month, or about 123 daily. Fatal car accident rates differ across states for a variety of different reasons.
This study delves into the complexities of road safety, revealing the safest and most dangerous states for driving, categorized by the amount of car accident fatality rates.
Notably, New York, Massachusetts, and New Jersey were the safest states, while Wyoming, Mississippi, and Arkansas were the most dangerous. Despite a 6% rise in motor vehicle deaths since 2020, there was a nearly 3% drop from 2022.
The report also highlights states with notable changes in fatality rates, including Rhode Island, Arizona, and South Dakota, with the highest increases, and Nebraska, Maine, and Hawaii, with the largest decreases.
This concise analysis aims to provide insights into state-wise road safety in the U.S., contributing to informed discussions and strategies for improving national road safety.
Key Findings
- The U.S. recorded 44,986 motor vehicle fatalities in 2023, which translates to an average of 3,749 deaths per month or about 123 daily.
- The safest states for driving were New York, Massachusetts, and New Jersey, which had the lowest fatality rates, contrasted with Wyoming, Mississippi, and Arkansas, which were the most dangerous states for driving.
- In 2023, car accident deaths in the U.S. increased by 6% from 2020 but thankfully fell nearly 3% from the previous year, 2022.
- Rhode Island (50%), Arizona (38%), and South Dakota (34%) had the highest increases in fatalities, while Nebraska (24%), Maine (23%), and Hawaii (21%) saw the largest decreases.
Safest and Riskiest States for Driving–by Car Accident Fatality Rates, 2024

Ranking States by Number of Car Accident Deaths per 100K People
Top 10 Safest States for Driving, by Car Accident Fatality Rate
Here, we look at the states where driving is safest by comparing car crash deaths to the total number of people living there. These places have the fewest accidents, showing they're at least doing something right for road safety.

1. New York
With a substantial population of over 19.5 million, New York stands as the safest state with a low fatality rate of 5 deaths per 100k people, totaling 1,055.92 deaths, which demonstrates their effective road safety policies in an extremely high-density region.
2. Massachusetts
Massachusetts follows with a fatality rate of 6 deaths per 100k people from a population of 7 million. The total number of deaths are 392.33, indicating a strong commitment to road safety.
3. New Jersey
New Jersey, with a population nearing 9.3 million, has a fatality rate of 7 deaths per 100k people. Its total deaths are 658.99, positioning it as one of the safest states for driving.
4. Hawaii
Hawaii’s smaller population of 1.4 million has a death rate of 8 per 100k people, with total deaths at 110.34, which suggests that its road safety measures are relatively effective.
5. Rhode Island
With a population of over 1 million and a death rate of 8 per 100k people, Rhode Island's total deaths are 87.36, showcasing its status as a safe state for motorists.
6. Minnesota
Minnesota, with a population of 5.7 million, has a fatality rate of 8 deaths per 100k people. The state's total deaths are 458.23, indicating a successful approach to traffic safety.
7. Utah
Utah has a higher death rate of 10 per 100k people for its population of 3.4 million. The total deaths are 324.90, suggesting challenges but still making it one of the safer states.
8. Alaska
Despite its vast geography and smaller population of 733,406, Alaska records a death rate of 10 per 100k people, with total deaths at 75.09, reflecting unique challenges in road safety due to its complicated terrain.
9. California
California, with the largest population of nearly 39 million, maintains a death rate of 10 per 100k people. The total deaths amount to 4,023, showing the state's significant efforts in road safety, given its massive population and high traffic volumes
10. Connecticut
With a population of 3.6 million, Connecticut has a death rate of 10 per 100k people. Their total motor vehicle death in 2023 is around 375.47, which is slightly higher for its population size but still makes the state comparatively safer than the remaining 40.
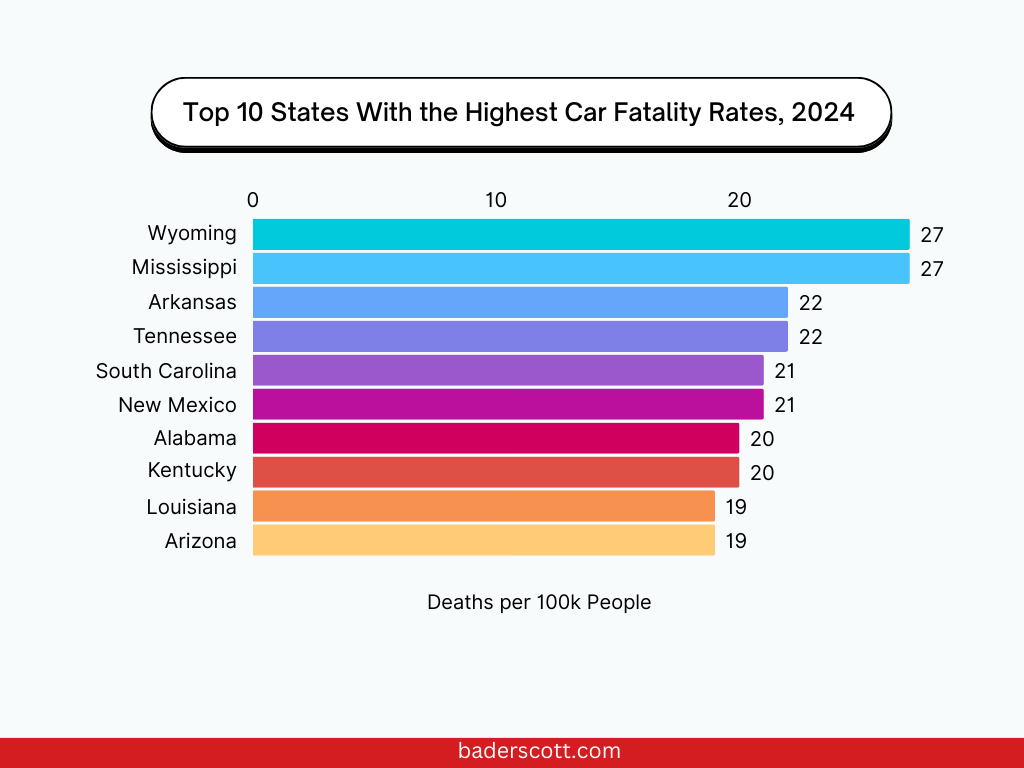
Top 10 Riskiest States for Driving, by Car Accident Fatality Rate
Identifying the most dangerous states for drivers, this overview ranks states by their car accident fatality rates. The data reflects total deaths in comparison to state populations, spotlighting where driving carries the greatest risk.

1. Wyoming
Despite having the smallest population of 584.1k among the listed states, Wyoming ranks as the most dangerous state with 27 deaths per 100k people. The total death count is 159.38, which is significant given the state's smaller population.
2. Mississippi
Mississippi has a population of 2.9 million and matches Wyoming's fatality rate with 27 deaths per 100k people. With a total of 799.99 deaths, it suggests a high level of road safety risk relative to its population.
3. Arkansas
Arkansas, with a slightly larger population of 3.1 million, has a fatality rate of 22 deaths per 100k people. The total number of deaths is 688.11, placing it third in the ranking.
4. Tennessee
Tennessee has a significantly higher population of 7.1 million and a fatality rate of 22 deaths per 100k people. It records the highest absolute number of deaths at 1,569, indicating a critical concern for road safety.
5. South Carolina
With a population of 5.4 million, South Carolina's fatality rate stands at 21 deaths per 100k people. The state has a total of 1,138.68 deaths, which is relatively high compared to its population.
6. New Mexico
New Mexico, with a population of 2.1 million, has a fatality rate of 21 deaths per 100k people. The total deaths are 447.50, which is proportionately high for its population size.
7. Alabama
Alabama's population of 5.1 million and a fatality rate of 20 deaths per 100k people result in a total of 1,029.87 deaths, suggesting a significant road safety issue in the state.
8. Kentucky
With a population of 4.5 million, Kentucky has a fatality rate of 20 deaths per 100k people. It sees a total of 910.33 deaths, positioning it eighth on the list.
9. Louisiana
Louisiana has a population of 4.6 million and a lower fatality rate of 19 deaths per 100k people compared to those above it on the list. It has a total of 881.21 deaths.
10. Arizona
Arizona, with the largest population on the list at 7.4 million, has a fatality rate of 19 deaths per 100k people. The total number of deaths is 1,408.41, which is the second-highest in absolute terms.
Top 10 States with the Largest Increase in Car Accidents Deaths (2022-2023)
The data presented captures a concerning uptrend in car accident deaths across various states for the first nine months of 2023, compared to the same period in 2022.
| State | No. of Months Reported | Car Accident Deaths 2023 | Car Accident Deaths 2022 | Percent Changes |
| Rhode Island | 9 | 57 | 38 | 50% |
| Arizona | 9 | 919 | 664 | 38% |
| South Dakota | 9 | 111 | 83 | 34% |
| Idaho | 9 | 188 | 160 | 18% |
| Maryland | 9 | 445 | 383 | 16% |
| Iowa | 9 | 284 | 255 | 11% |
| Kentucky | 9 | 594 | 533 | 11% |
| West Virginia | 9 | 198 | 179 | 11% |
| Wyoming | 9 | 104 | 95 | 9% |
| North Dakota | 9 | 83 | 79 | 5% |
1. Rhode Island
Experienced the highest increase, with a 50% rise in car accident deaths, up from 38 in 2022 to 57 in 2023.
2. Arizona
Recorded a 38% jump in car accident deaths, with numbers increasing from 664 to 919 year over year.
3. South Dakota
Had a 34% increase in car accident deaths, going from 83 in 2022 to 111 in 2023.
4. Idaho
Reported an 18% increase in fatalities, with deaths rising from 160 to 188.
5. Maryland
Observed a 16% increase in car accident deaths, with totals going from 383 to 445.
6. Iowa
Car accident deaths increased by 11%, from 255 to 284.
7. Kentucky
Saw an 11% increase in car accident fatalities, with numbers rising from 533 to 594.
8. West Virginia
Had an 11% increase, with deaths due to car accidents going from 179 to 198.
9. Wyoming
With a 9% rise in car accident deaths, Wyoming ranks second to last, from 95 in 2022 to 104 in 2023.
10. North Dakota
Experienced the smallest increase in the top 10, with a 5% rise in car accident deaths, from 79 in 2022 to 83 in 2023.
Top 10 States with the Largest Decrease in Car Accident Deaths (2022-2023)
In a positive turn, the following states have demonstrated a noteworthy reduction in car accident deaths for the first nine months of 2023 compared to the same period in 2022.
| State | No. of Months Reported | Car Accident Deaths 2023 | Car Accident Deaths 2022 | Percent Changes |
| Nebraska | 9 | 156 | 204 | -24% |
| Maine | 9 | 98 | 127 | -23% |
| Hawaii | 9 | 72 | 91 | -21% |
| Massachusetts | 9 | 256 | 319 | -20% |
| New Jersey | 9 | 430 | 528 | -19% |
| Montana | 9 | 138 | 167 | -17% |
| New Mexico | 9 | 292 | 347 | -16% |
| Vermont | 9 | 53 | 63 | -16% |
| California | 9 | 2,625 | 3,083 | -15% |
| Minnesota | 9 | 299 | 343 | -13% |
1. Nebraska
Led the way in improved road safety with car accident deaths decreasing by 24%, from 204 in the first nine months of 2022 to 156 in the same period of 2023.
2. Maine
Followed closely with a 23% reduction in fatalities, dropping from 127 to 98 in the year-over-year comparison.
3. Hawaii
Displayed a significant decline in road fatalities with a 21% decrease, from 91 deaths to 72.
4. Massachusetts
Showed notable progress with a 20% fall in car accident deaths, reducing from 319 to 256.
5. New Jersey
Reported a 19% decrease in car accident fatalities, with a reduction from 528 to 430.
6. Montana
Witnessed a decline in road deaths by 17%, from 167 to 138.
7. New Mexico
Observed a 16% decrease in fatalities due to car accidents, from 347 down to 292.
8. Vermont
Saw car accident deaths decline by 16%, from 63 to 53.
9. California
Despite its large size, California achieved a 15% reduction in car accident deaths, from 3,083 to 2,625.
10. Minnesota
Closes out the list with a 13% drop in car accident deaths, from 343 to 299.
Methodology
Objective and Data Collection
The study aimed to analyze 2023 car accident fatalities by the state–excluding the District of Columbia in relation to population size, and identifying safety levels. We collected fatality data from the National Health Council for the first nine months of 2023 and obtained population data from government records.
Projection and Rate Calculation
We projected fatalities for the final quarter to estimate annual statistics. We calculated the death rates per 100,000 people for each state using these figures.
Analysis and Ranking
The states were ranked by fatality rates to determine the safest and most dangerous for driving. Additionally, we compared the 2023 data with 2022 to highlight states with significant year-over-year changes in car accident deaths.
